
Section 1: Describing Motion
If you look around you, you will probably notice many things in motion: a classmate chewing gum, a ball rolling across the floor, or an airplane flying across the sky. Motion is happening everywhere, from people walking through a hallway to planets orbiting the Sun. In science, motion occurs when an object changes its position relative to a reference point. A reference point is a place or object used for comparison to determine whether something has moved. For example, a student walking past a desk is changing position relative to the desk.

When describing the motion of an object, scientists often refer to its distance, or how far it has moved. The SI unit of distance and length is the meter (m). However, distance alone does not always fully describe motion. Scientists also use displacement, which describes both the distance and direction of an object’s change in position from its starting point. For example, if a runner moves 100 meters east from the starting line, the displacement includes both the 100-meter distance and the eastward direction.
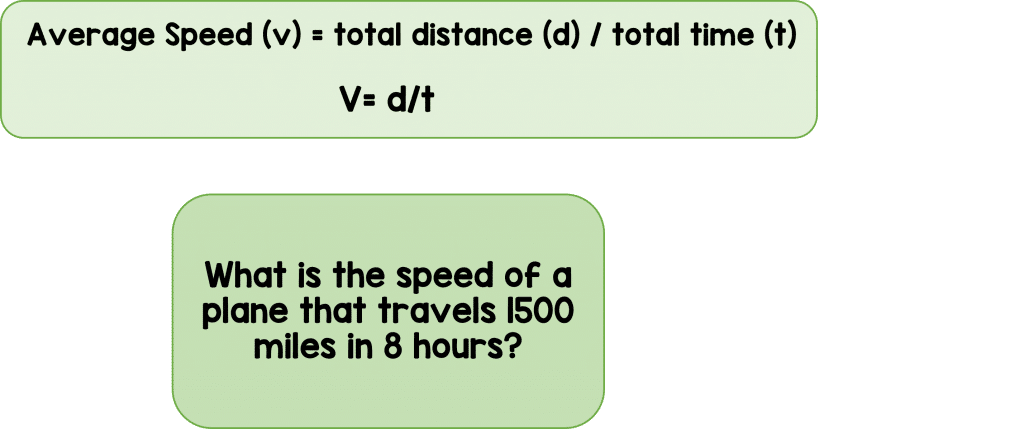
To better understand motion, scientists measure how fast an object moves and the direction in which it travels. How fast something moves is called speed. Speed describes the distance an object travels per unit of time, and its SI unit is meters per second (m/s). To calculate average speed, divide the total distance traveled by the total time it took to travel that distance. For example, if a cyclist travels 100 meters in 20 seconds, the average speed is 5 m/s.

There are three common types of speed: instantaneous, average, and constant. Instantaneous speed is the speed of an object at a specific moment in time. A car’s speedometer shows instantaneous speed because it displays how fast the car is moving at that exact moment. Average speed is the total distance traveled divided by the total time, as in calculating the average speed during a long road trip. Constant speed occurs when an object’s speed does not change over time. For example, a car using cruise control on a highway may travel at a nearly constant speed for several miles.

Scientists often use graphs to represent and analyze motion. One common type is a distance-time graph, which shows how an object’s distance changes over time. On this graph, time is plotted on the x-axis and distance is plotted on the y-axis. By studying the shape and slope of the graph, scientists can determine whether an object is moving quickly, slowly, or remaining at rest. Distance-time graphs help scientists visualize motion and compare how different objects move over time.
Review:
- What is displacement?
- Identify the equation used to determine the average speed of an object.
- Compare instantaneous speed to constant speed.